Explanation of Phase 1 and Phase 2 Computational Biology Research
Below is an explanation of the figures, results, data, and more of a computational biology project, a single-cell computational analysis of nitric oxide–related gene programs in endothelial cells to investigate drug-specific mechanisms of endothelial dysfunction in human atherosclerosis.
RESEARCH
Avya Patel
12/23/202517 min read
Summary of NOS3, GCH1, NOX4 signaling pathways, and NO pathway:
Role of NOS3:
Produces NO
Role of GCH1:
Makes BH4 (a cofactor)
Role of NOX4:
Produces ROS, activates and is harmful is NO bioavailability is low
In this project, GSE13778 lacked GCH1 and NOX4, instead,
“NOS3", "KLF2", "PECAM1” were used for NO_genes
"HMOX1", "SOD2", "GCHFR" were used for BH4_genes
"CYBB", "DUOX2", "ATF3", "IER3", "NCF1" were used for ROS_genes
Generality:
Nitric oxide is an important signaling molecule associated with diverse signaling pathways in target cells: associated with many physiological processes (neuronal signaling, ion channels, immune response, inflammatory responses/ processes, and cardiovascular homeostasis.
In endothelial cells, the primary producer of NO is endothelial NO synthase (eNOS).
NO is synthesized by L-arginine in different NOS
NO is also an inhibitor of platelet aggregation: “during aggregation in vivo may cause contraction of de-endothelialized canine coronary artery rings, whereas they induce relaxation in presence of endothelium”. NO plays a role in calcium ion channels (biological communication).
Role of NO in ECs and cardiovascular system:
In the presence of BH4, NOS monomers from homodiners are capable of donating electrons from NADPH to catalyze the 2-step oxidation of l-arginine to l-citrulline and NO. In the first step (https://pmc.ncbi.nlm.nih.gov/articles/PMC9015729/)
In the first step, NOS promotes the hydroxylation of l-arginine to Nω-hydroxy-l-arginine, which remains bound by the enzyme. In the second step, NOS catalyzes the oxidation of Nω-hydroxy-l-arginine to l-citrulline, thereby releasing NO.
When NO is bound to CaM (calcium signaling protein calmodulin), the transfer of electrons from FMN to FAD is enhanced.
NO signaling directly correlates with increase of cyclic GMP, and hence, relaxation of VSMCs.
NO exerts anti-platelet effects through inhibition of platelet aggregation and adhesion; furthermore, eNOS-derived NO from platelets likely has both autocrine and paracrine inhibitory effects in a developing thrombus to limit pathologic clot formation.
Also helps with making new blood vessels (angiogenesis).
For the cardiovascular system, cardiomyocytes normally express nNOS and eNOS, iNOS is common in inflammation and injury. NOS uncoupling leads to ROS formation and later oxidative stress.
Role of NOS3:
eNOS and NOS3 (https://www.sciencedirect.com/science/article/abs/pii/S0378111915011701?via%3Dihub):
NOS3 encodes eNOS, the main source of NO in vascular endothelial cells. eNOS catalyzes the conversion of L‑arginine into nitric oxide (NO) + L‑citrulline, using cofactors (heme, FAD, FMN, tetrahydrobiopterin (BH₄), calmodulin, NADPH) to produce NO, a major signaling molecule for vascular homeostasis.
Regulation of NOS3 is multilayered — at transcriptional, post‑transcriptional, and post‑translational levels. That means NOS3 expression and activity depend not just on gene expression but also splicing, promoter usage, protein modifications (e.g. phosphorylation), subcellular localization, and cofactor availability.
Proper eNOS “coupling” is critical: with adequate cofactors (especially BH₄) and favorable redox conditions, eNOS produces NO; but under conditions of cofactor deficiency or oxidative stress, eNOS may become “uncoupled” and instead generate reactive oxygen species (ROS) — contributing to endothelial dysfunction.
NO produced by NOS3/eNOS has major vasoprotective effects: it promotes vasodilation (smooth muscle relaxation), regulates vascular tone and blood pressure, inhibits platelet aggregation, reduces leukocyte adhesion, and limits smooth muscle proliferation — together maintaining vascular homeostasis and protecting against atherosclerosis.
Genetic variation in NOS3 may influence cardiovascular risk. The review discusses how polymorphisms/haplotypes of NOS3 can alter gene expression or enzyme activity, thereby affecting endogenous NO formation — which may modulate susceptibility to vascular diseases (hypertension, coronary artery disease, endothelial dysfunction).
Environmental and pathophysiological factors impact NOS3 function. Factors such as oxidative stress, cofactor depletion (e.g., low BH₄), inflammatory signals, or impaired post‑translational regulation can disrupt eNOS function and reduce NO bioavailability — contributing to endothelial dysfunction and vascular disease.
NOS3/eNOS is a promising therapeutic target. Because of its central role in vascular health, strategies aiming to preserve eNOS coupling (e.g. ensuring BH₄ availability), reduce oxidative stress, or modulate NOS3 regulation may have beneficial effects in cardiovascular and cerebrovascular diseases.
NOS3 and NO summary https://einstein.elsevierpure.com/en/publications/endothelial-nitric-oxide-synthase-from-biochemistry-and-gene-stru/, https://pmc.ncbi.nlm.nih.gov/articles/PMC9690224/, https://pubmed.ncbi.nlm.nih.gov/15001455/
NOS3 is the main NOS isoform in the vascular endothelium; the NO generated by eNOS is critical for vascular homeostasis — controlling vascular tone (vasodilation), inhibiting platelet aggregation, reducing vascular inflammation, and preventing excessive smooth muscle proliferation.
Genetic deletion (knockout) of NOS3 in mice leads to vascular pathology: in one study, double knockout of NOS3 and APOE (atherosclerosis‑prone mouse model) resulted in more severe atherosclerotic lesions and hypertension compared with APOE-only knockout mice — indicating that loss of NOS3 accelerates atherosclerosis.
Loss of NOS3 also impairs proper cardiac and vascular development: in fetal / early‑life studies, NOS3 deficiency caused hypoplastic coronary arteries, reduced vessel density/volume, increased ventricular wall thickness, and predisposition to myocardial infarction in postnatal mice.
However — and this is important — more NOS3 (or over expression) is not automatically protective. In a model where eNOS was chronically over expressed in an atherogenic (apoE‑deficient) background, those mice actually developed more atherosclerotic lesions compared with controls. The authors suggested this might be due to “dysfunctional” eNOS: despite high eNOS expression, NO bioavailability was low (relative to expression), possibly due to oxidative stress / cofactor imbalance, and superoxide (ROS) production increased.
Thus, the protective effects of NOS3 depend on its functional integrity (proper coupling, sufficient cofactors like BH₄, and redox balance) — not merely on high expression. If NOS3 becomes “uncoupled,” it may produce reactive oxygen species (superoxide) instead of NO, undermining vascular health.
Role of GCH1: https://academic.oup.com/cardiovascres/article/114/10/1385/4955198:
BH4 and iNOS:
BH4 is produced and catalyzed by GTPCH: BH4 is a cofactor for NOS1-3, controlling NO in general.
Look at association between BH4 and iNOS (iNOS leads to macrophage activation and co-localizes with aras of protein nitration and lipid oxidation. BH4 is also a cofactor for iNOS even though it causes inflammation.
Inflammatory stimulation typically induces both iNOS expression, and increased BH4 biosynthesis (https://academic.oup.com/cardiovascres/article/114/10/1385/4955198). Patients with atherosclerosis have lowered amounts of BH4, and hence, lowered inflammatory biomarkers. High amounts of BH4 mean that there will be higher amounts of NO produced as iNOS is activated in presence of immune attack and NO helps the immune system.
iNOS needs more BH₄ than eNOS because its output is higher → BH₄ availability becomes a limiting factor.
Endothelial deficiency of BH4 leads to enhanced vasoconstriction, impaired vasodilation, and endothelial cell dysfunction
Preservation of eNOS, but selective loss of NO generation due to BH4 deficiency is associated with increased endothelial cell superoxide and ROS generation. I
Role of gene Gch1:
Decrease of Gch1 expression in ECs result in increased atherosclerotic burden.
Since Gch1 lowers BH4 and causes eNOS uncoupling→ leads to increased superoxide (ROS) production, reduced NO, and ultimately worsened endothelial dysfunction.
In a mouse model lacking Gch1 in endothelial cells and leukocytes (on an atherosclerosis-prone background), BH₄ levels drop, and this deficiency is associated with increased atherosclerotic burden compared with controls
Loss of Gch1/BH₄ in endothelium/leukocytes is accompanied by markers of endothelial dysfunction: impaired endothelium-dependent vasodilation, increased expression of vascular adhesion molecule (e.g. VCAM-1), and increased blood pressure (mildly).
In macrophages (myeloid cells), Gch1/BH₄ deficiency leads to altered redox signalling: increased reactive oxygen species (ROS), decreased antioxidant gene expression, and increased foam-cell formation (which contributes to plaque formation).
The paper (https://academic.oup.com/cardiovascres/article/114/10/1385/4955198) concludes that BH₄ supplied via Gch1 in both endothelial cells and macrophages is “important … for regulation of NOS function and cellular redox signalling in atherosclerosis.”
Role of Nox4 https://pubmed.ncbi.nlm.nih.gov/26578199/:
Background on NOX isoforms:
Increased expression of NOX1 and NOX2 in vascular cells and macrophages has been reported as contributing to atherosclerosis and vascular diseases
Lowering the NOX2 gene leads to endothelial relaxation.
NOX5 is associated with oxidative stress in endothelium.
NOX4 is also related to protection from oxidative stress.
Nox4 Human EC en-vitro https://www.ahajournals.org/doi/10.1161/atvbaha.107.149450
NOX4 in human ECs enhances the cells’ angiogenic properties (allows more vessel formation). It also plays a role in EC redox reactions
Silencing Nox4 silencing leads to lowered angiogenic responses in ECs.
NOX4 gene also influences EC migration and proliferation (Cells treated with NOX4 siRNA exhibited decreased growth rates in the presence of serum, VEGF, or their combination)
NOX4 is expressed in endothelial cells (in human microvascular and umbilical-vein endothelial cells) and contributes to ROS (reactive oxygen species) — specifically H₂O₂ / redox signaling, not necessarily harmful oxidative stress.
Reducing NOX4 expression (via siRNA) reduced endothelial angiogenic responses (in vitro), including tube formation (a surrogate for vessel-formation) and wound-healing/migration.
Conversely, over expression of wild-type Nox4 enhanced those angiogenic responses; expression of a dominant-negative Nox4 suppressed them. Mendeley
The pro-angiogenic effects of NOX4 over expression could be mimicked by applying exogenous H₂O₂, and conversely, were attenuated by antioxidants (implying that NOX4’s effects are mediated via ROS/H₂O₂ signaling). Mendeley
Mechanistically, NOX4-mediated ROS appears to enhance receptor-tyrosine kinase activation and downstream signaling (e.g. ERK pathway), which likely contributes to proliferation, migration — functions necessary for angiogenesis. Mendeley
Implications for NO and vascular function / EC biology (in context of NOX4): https://www.ahajournals.org/doi/10.1161/atvbaha.107.149450
The fact that Nox4-derived ROS (especially H₂O₂) can promote endothelial proliferation, migration and angiogenesis suggests that Nox4 is not simply a “bad ROS-producer,” but may act as a physiological modulator of endothelial behavior (growth, repair, new vessel formation) under certain conditions.
Because these processes (angiogenesis, endothelial repair) often involve nitric oxide synthase pathways (e.g., eNOS) — and because ROS/H₂O₂ signalling can modulate eNOS activation and NO bioavailability — Nox4 may indirectly influence NO signalling positively (or at least in a coordinating way) in contexts such as vascular growth or remodeling. Indeed, in later studies, NOX4 overexpression was shown to promote eNOS expression/activity and endothelial function. https://pubmed.ncbi.nlm.nih.gov/21788590/
NOX4 in mice en-vitro (https://academic.oup.com/eurheartj/article/37/22/1753/1748802?login=false):
In the present study, we were able to show that loss of H2O2-releasing NOX4 in a genetic background of hypercholesterolaemia leads to severe endothelial dysfunction.
NOX4 is a constitutively active NADPH oxidase isoform — unlike many NOX family members which produce superoxide (O₂⁻), NOX4 predominantly produces hydrogen peroxide (H₂O₂).
Genetic deletion of NOX4 (in a mouse model lacking both NOX4 and the LDL-receptor, placed on a high-fat diet) led to increased atherosclerotic plaque burden in the aortic arch compared with LDLR-knockout controls.
The increased atherosclerosis was accompanied by markers of worsened vascular pathology: increased galectin-3 (a macrophage/ inflammation marker) in plaques, and increased collagen content in the media — suggesting more advanced or fibrotic lesions.
Ex vivo studies of aorta from NOX4-deficient mice showed impaired endothelium-dependent vasodilation (i.e. endothelial dysfunction) compared with controls, indicating NOX4 contributes to maintaining normal vascular function.
The authors interpret their data to suggest that NOX4-derived ROS (H₂O₂) is not necessarily harmful — instead it may play a protective, homeostatic role in vascular wall biology. In other words: under physiological / certain pathological conditions, NOX4 acts as an endogenous anti-atherosclerotic enzyme.
Explanation of Figures (Phase 1):
Fig 2. Violin Distribution of NO, BH4, and ROS Module Scores in Endothelial Cells. Note that GCH1 was not expressed nor was NOX4, so proxy genes were included in the dataset for the violin plot. Answers question of “Across endothelial cells, how strongly is each pathway active?”
Gene module scoring revealed heterogeneity in endothelial redox states within the GSE13778 dataset, with NO, BH₄ proxy, and ROS scores capturing coordinated shifts in nitric oxide signaling, antioxidant capacity, and oxidative stress across endothelial subpopulations.
NOS3 → NO production
KLF2 → shear-stress–responsive transcription factor that up regulates eNOS
PECAM1 → endothelial identity and mechanotransduction
HMOX1 → stress-inducible antioxidant enzyme
SOD2 → mitochondrial superoxide detoxification
CYBB / NCF1 → NADPH oxidase components (ROS production)
DUOX2 → hydrogen peroxide generation
ATF3 / IER3 → oxidative stress–responsive transcriptional programs
High NO score means:
Endothelial cells are in a healthy, shear-responsive, vasoprotective state
Likely anti-inflammatory, anti-thrombotic phenotype
Low NO score means:
Endothelial dysfunction
Impaired NO bioavailability
High BH₄ proxy score means:
Strong antioxidant response
Reduced superoxide
Indirect support of NO bioavailability
Low BH₄ proxy score means:
Weak redox buffering
Greater risk of eNOS uncoupling and oxidative damage
High ROS score means:
Active oxidative stress signaling
Increased ROS production
Potential NO scavenging (NO + O₂⁻ → ONOO⁻)
Figure 3 (above). Predicted drug-response gene expression in endothelial cells.
UMAP of endothelial cells from the GSE13778 dataset, colored by module scores for statin-associated genes (Statin_NET: 'NOS3', 'KLF2', 'THBD', 'NOSTRIN', 'THBS1', 'VCAM1', 'ICAM1', 'SELE', 'IL6', 'EDN1'), ACE inhibitor–associated genes (ACEI_score: 'HMOX1', 'ACE2', 'VEGFA', 'AGTR1'), and calcium channel blocker–associated genes (CCB_score: 'PECAM1', 'SOD2', 'PTGS2', 'FLT1', 'ATF3', 'EDN1'). High scores indicate cells that would likely express these genes if treated with the corresponding drug, revealing heterogeneity in potential drug-responsive states across endothelial subpopulations.)
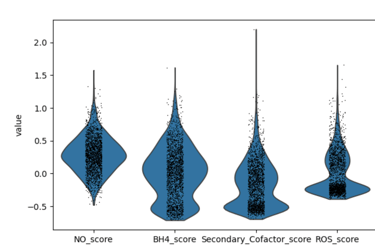
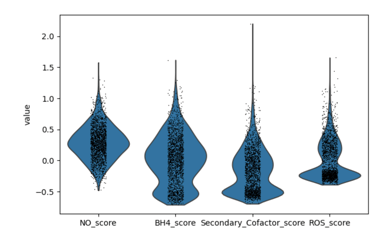
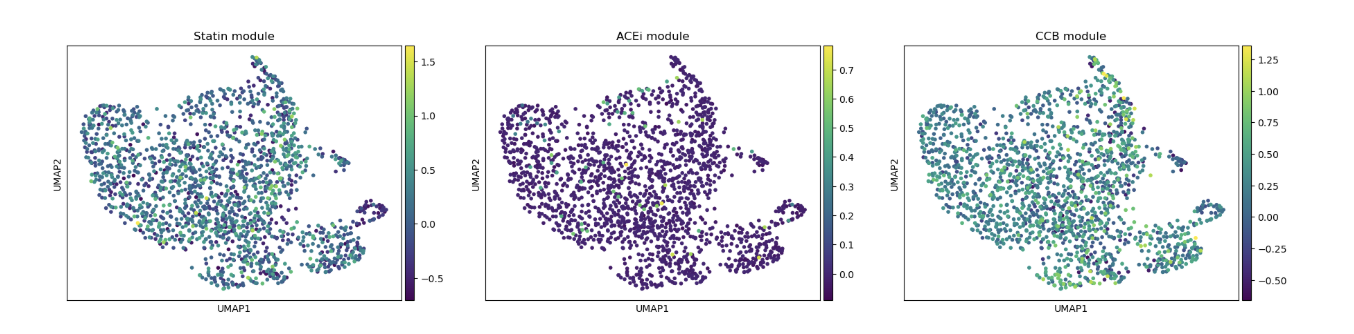
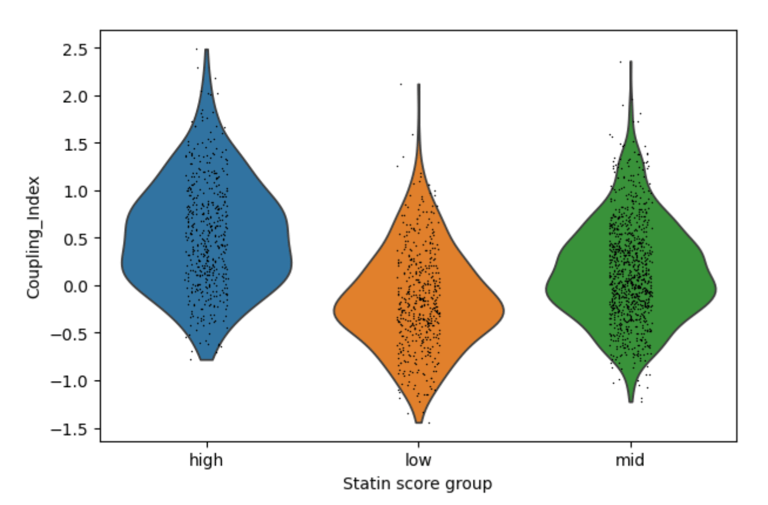

Fig 4. Violin plots of Coupling Index across endothelial cells stratified by low, medium, and high statin-like gene signature scores. Cells with higher statin-like expression of genes such as NOS3, KLF2, and THBD exhibit higher Coupling Index values, suggesting improved nitric oxide signaling relative to oxidative stress
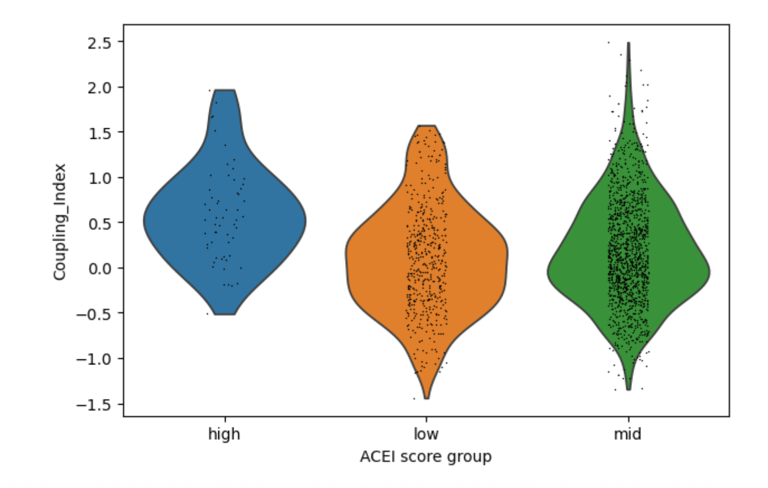
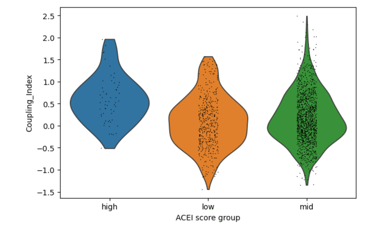
Fig 5. Cells with higher ACE inhibitor–like genes (HMOX1, ACE2) signatures show a modest increase in Coupling Index, suggesting a weaker but similar effect on NO signaling as Statins.
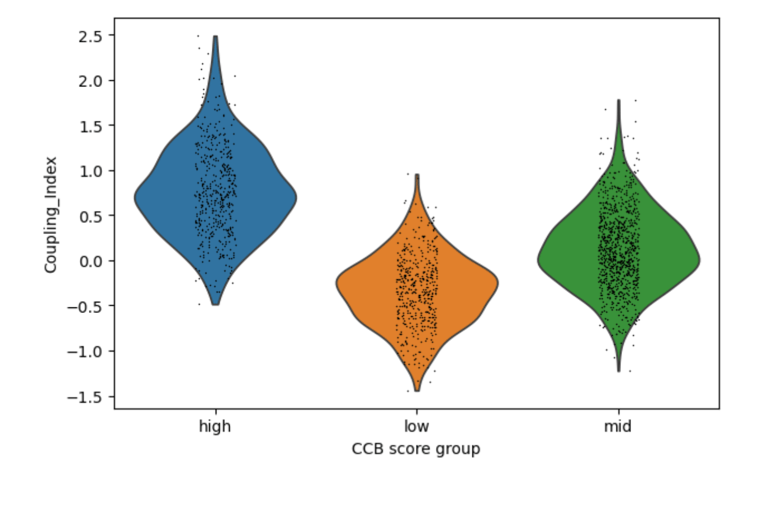
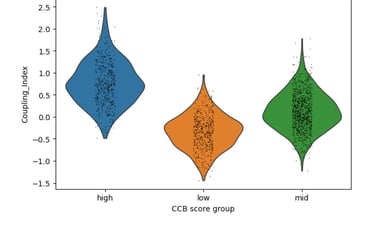
Fig 6. CCB-like signatures show major shifts in Coupling Index. C ells with higher statin-like expression of genes such as PECAM1 exhibit higher Coupling Index values, suggesting robust improvement in nitric oxide signaling relative to oxidative stress
Across Statins, ACEIs, and CCBs, drug-associated gene signatures correlate with distinct nitric oxide coupling states in endothelial cells, with CCB-like signatures showing the strongest association with improved NO signaling. Statin, ACEI, CCB scores just show the intensity of the target gene(s) selected for each drug.
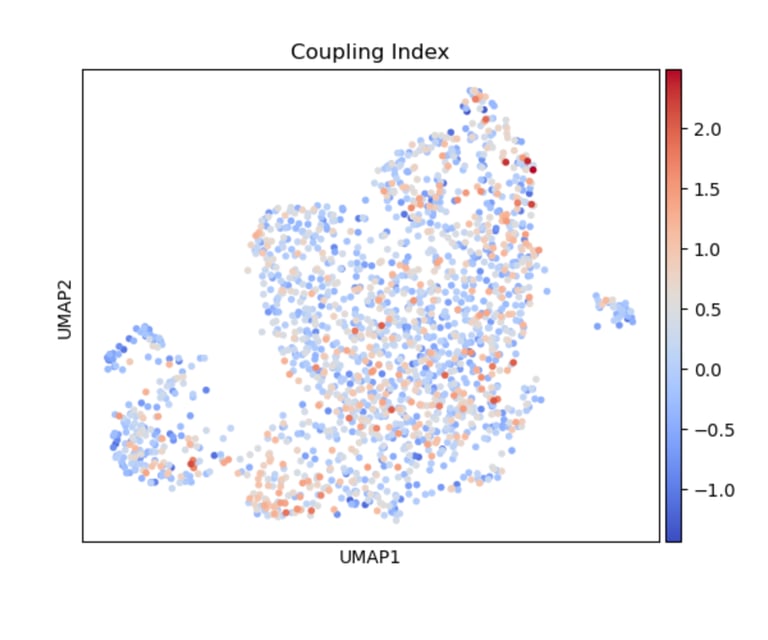
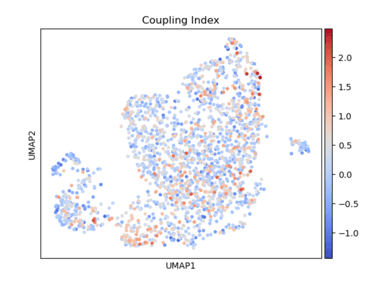
Fig 7. A heatmap of Coupling Index reveals cell-level nitric oxide production and coupling. At its core, the heatmap shows how nitric oxide balance varies across endothelial cells in relation to drug-associated gene signatures. The colors show the intensity of the Coupling Index (values of coupling index). Warmer colors indicated NO production> ROS production (healthy endothelial cells), coolor colors indicated NO production < ROS production (endothelial dysfunction).
It’s a cell-by-cell map of how favorable nitric oxide signaling is across different drug-associated gene signatures.
UMAP visualization of Coupling Index in endothelial cells, with warmer colors indicating higher Coupling Index values. Cells exhibiting elevated expression of statin-, ACE inhibitor-, or CCB-associated gene signatures tend to show higher Coupling Index, suggesting enhanced eNOS coupling and nitric oxide bioavailability in these subpopulations.
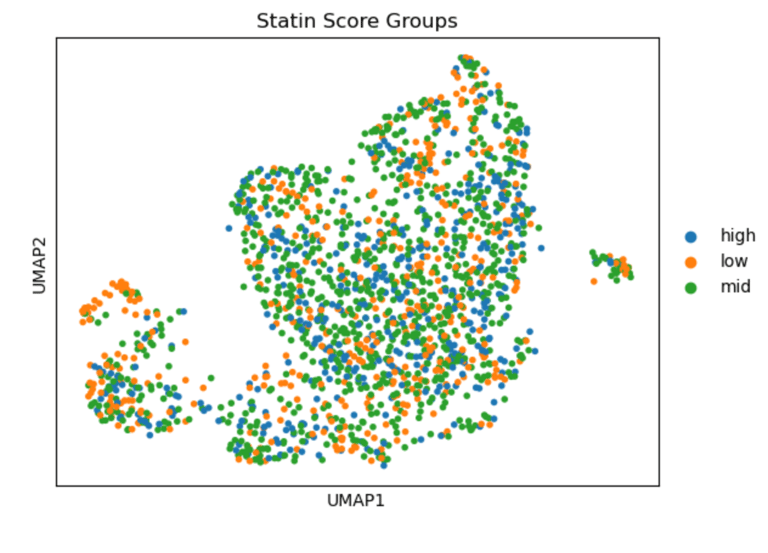
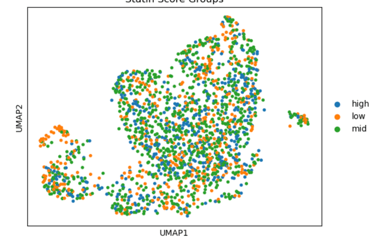
Fig 8. Heatmap of Coupling Index values across endothelial cells stratified by statin-like gene signature scores. Cells with higher statin-like signatures exhibit elevated Coupling Index values, indicating improved nitric oxide coupling relative to oxidative stress.
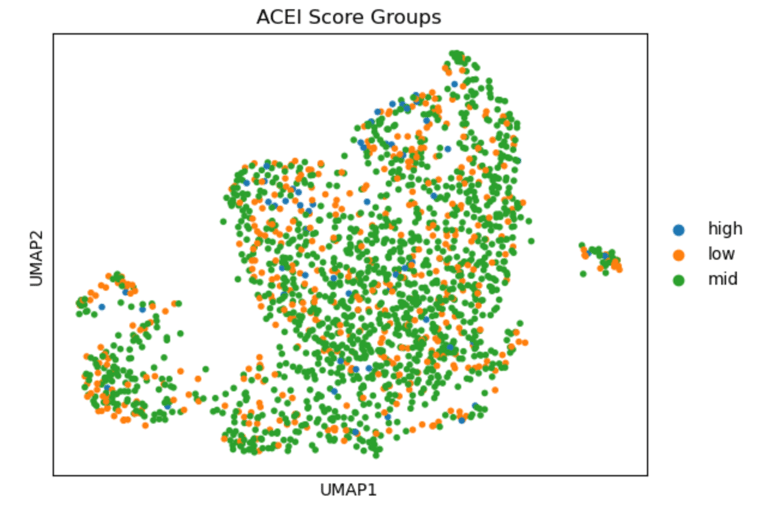
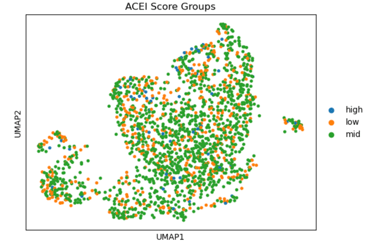
Fig 9. Heatmap of Coupling Index values across endothelial cells stratified by ACE inhibitor–like gene signature scores. Moderate increases in Coupling Index are observed in cells with higher ACEi-like signatures, suggesting a potential association between ACE inhibitor–related pathways and improved nitric oxide balance.
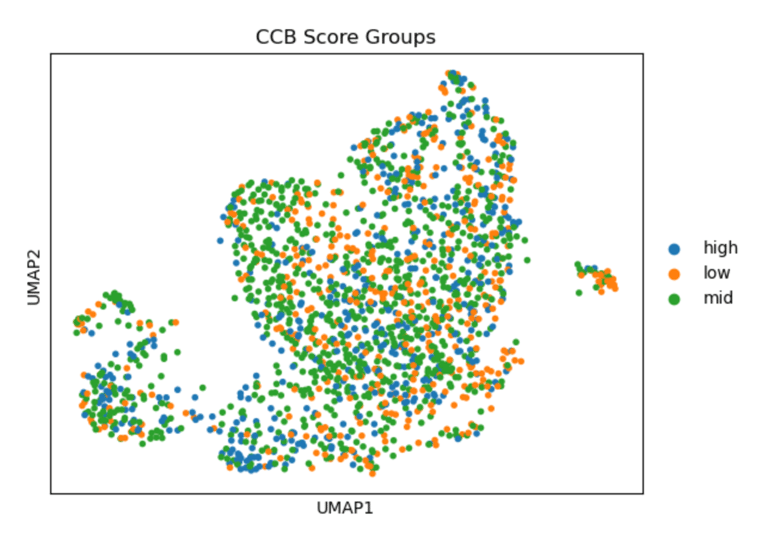
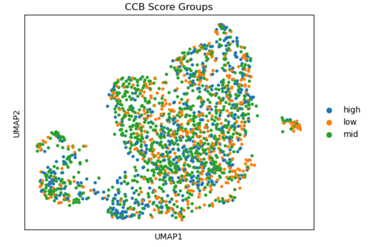
Fig 10. Heat map of Coupling Index values across endothelial cells stratified by calcium channel blocker–like gene signature scores. *Strong correlation between cells that have high levels of statin-like target genes, and the warmer spots of the heat map. This pattern supports violin plot results and is consistent with known effects of statins on endothelial NO signaling.
In summary, UMAPs of Statin, ACEI, and CCB score groups show the distribution of low (orange), mid (green), and high (blue) scoring endothelial cells. Cells with high Statin_NET and high CCN_NETscores co-localize with areas of high Coupling Index (warm colors), indicating that high expression of statin-associated genes corresponds to improved eNOS coupling and nitric oxide bioavailability. ACEI- and CCB-high score cells show similar but less pronounced associations.
Explanation of Figures (Phase 2):
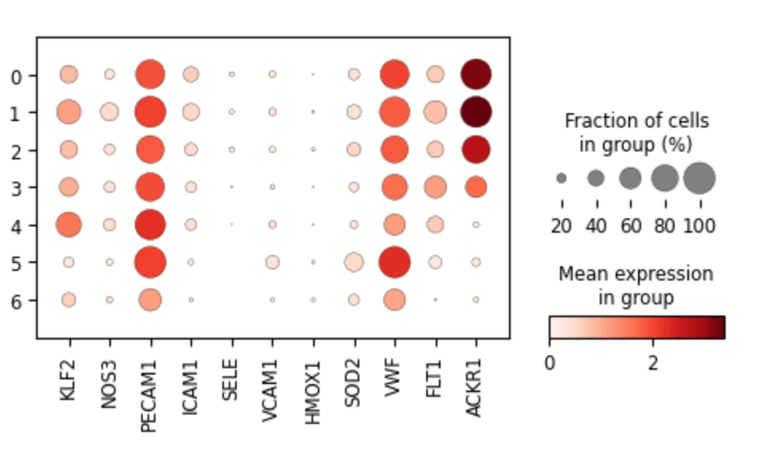
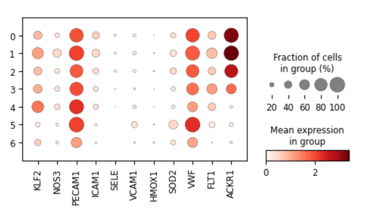
Fig 11. Dot plot showing marker gene expression across endothelial subclusters derived from original Leiden clusters.
Each dot represents the average expression and fraction of cells expressing key genes in subclusters, highlighting cluster-specific endothelial phenotypes such as arterial-like (VWF, FLT1), venous-like (ACKR1), flow-responsive (KLF2, NOS3), and inflammatory/activated states (VCAM1, SELE, ICAM1).
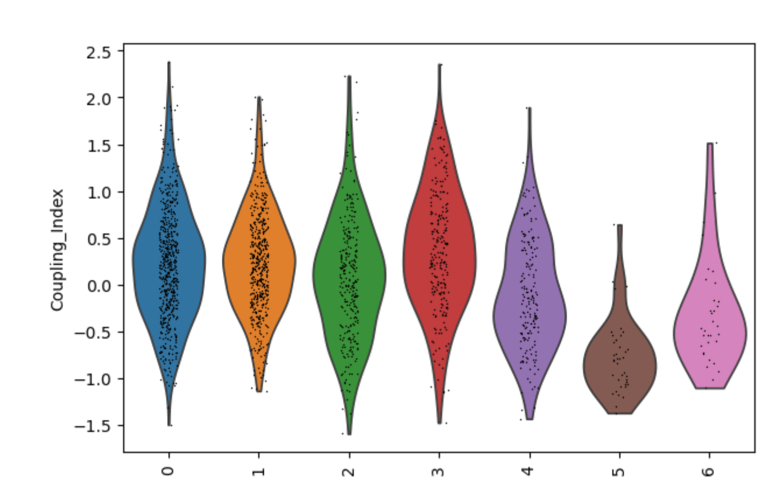
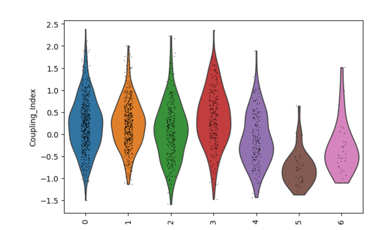
Fig 12. Violin plot of the endothelial NO coupling index across EC subclusters. The plot illustrates cluster-specific variation in nitric oxide bioavailability and oxidative stress responses, highlighting functional differences between subpopulations in the original Leiden clusters. Subclusters with higher coupling indicate healthier, flow-responsive endothelial phenotypes, whereas lower coupling reflects stressed or activated states.
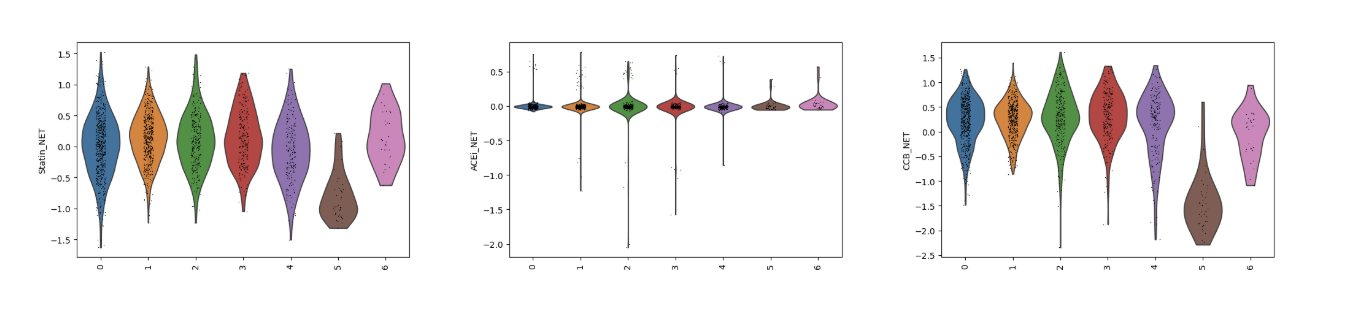
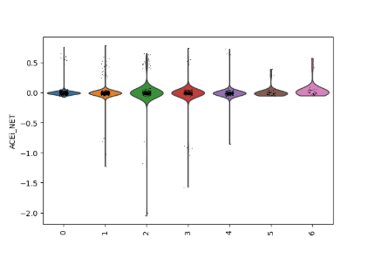
Fig 13. Violin plots of predicted drug responsiveness across EC subclusters. Statin, ACE inhibitor (ACEi), and calcium channel blocker (CCB) gene module scores are shown for each subcluster, capturing cluster-specific endothelial biology. These scores reveal which subpopulations are most likely to respond to each drug class, reflecting differences in flow-sensitivity, oxidative stress defense, and inflammatory activation.
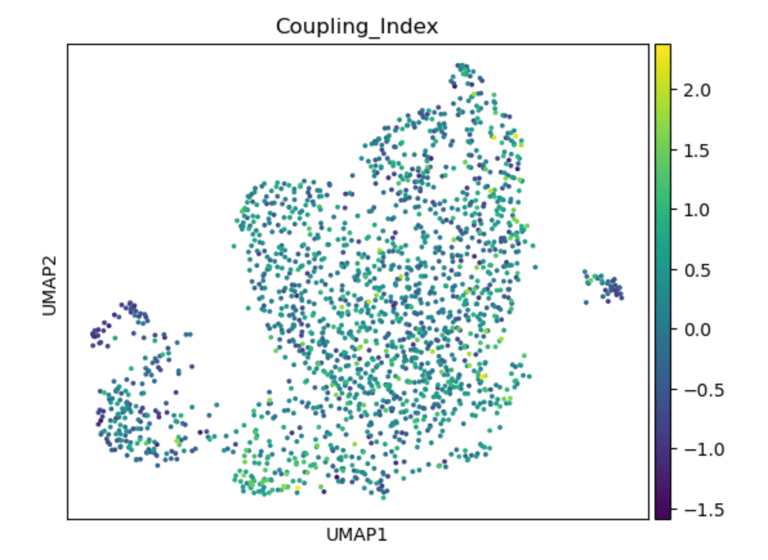
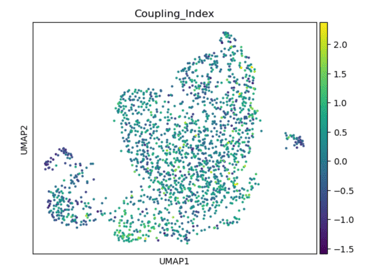
Fig 14. UMAP of endothelial cells colored by the Coupling Index. Subclusters with higher Coupling Index indicate healthier, NO-producing phenotypes, while lower values mark stressed or activated endothelial states.
Panel A: Coupling Index
Role / Why it’s needed:
Shows baseline NO bioavailability and eNOS coupling across endothelial subclusters. Provides a functional map of which subpopulations are healthy/flow-responsive versus stressed/activated.
What it shows:
Highlights subclusters with high vs low coupling; high coupling → functional, anti-oxidative, and shear-responsive ECs; low coupling → oxidative stress and inflammatory activation.
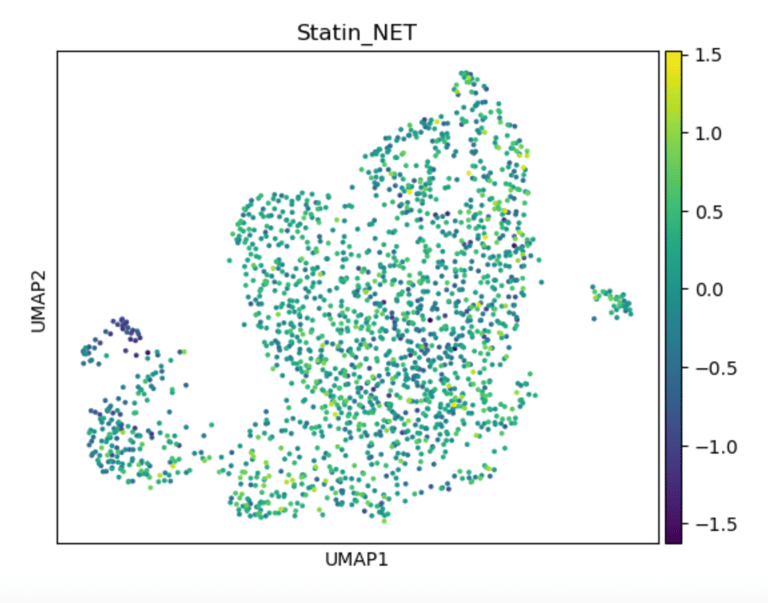
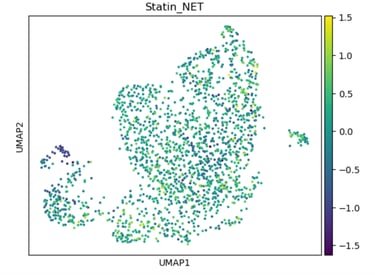
Fig 15. UMAP of endothelial cells colored by Statin_NET score. High scores indicate subpopulations most likely to respond to statins, reflecting enhanced eNOS activation, flow-responsiveness, and anti-inflammatory transcriptional programs.
Panel B: Statin_NET Score
Role / Why it’s needed:
Identifies which subclusters are predicted to respond to statin-like transcriptional programs, emphasizing pleiotropic, flow-responsive, and anti-inflammatory pathways.
What it shows:
Subclusters enriched for statin-responsive genes (e.g., KLF2, NOS3, THBS1) are highlighted, revealing where statins might restore NO signaling or reduce inflammation..
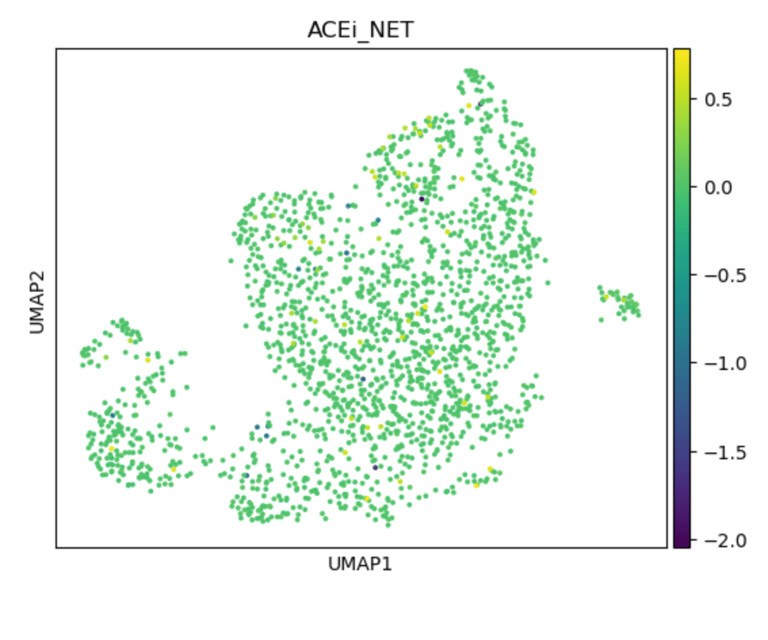
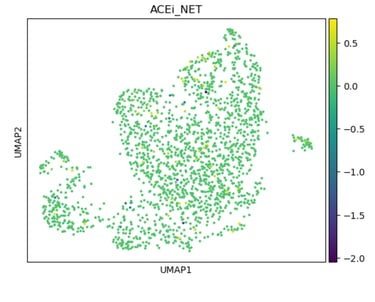
Fig 16. UMAP of endothelial cells colored by ACEi_NET score. High-scoring subclusters are predicted to respond to ACE inhibitors, with enhanced antioxidant capacity and bradykinin-mediated NO production.
Panel C: ACEi_NET Score
Role / Why it’s needed:
Shows ACE inhibitor-responsive subpopulations, emphasizing bradykinin-mediated NO release and antioxidant defense.
What it shows:
Subclusters enriched for ACEi target genes (e.g., BDKRB2, ACE2, CAT, SOD1) are highlighted, demonstrating cluster-specific drug sensitivity.
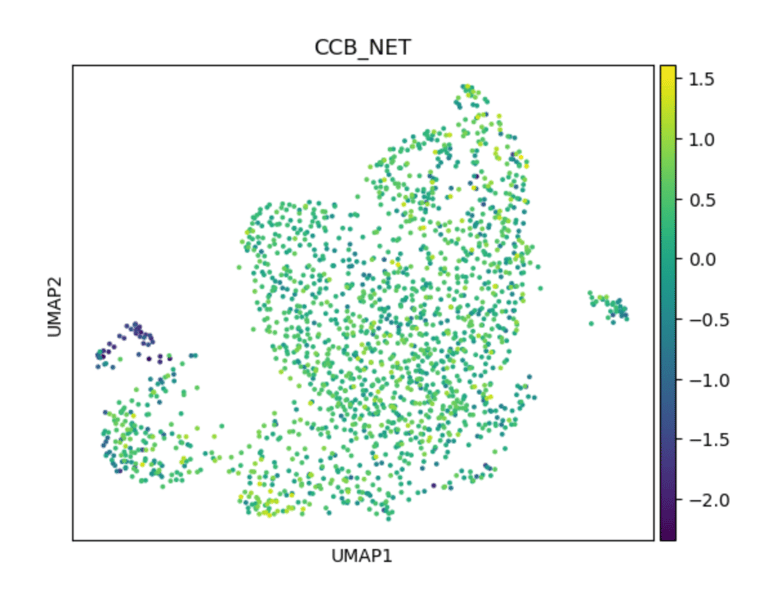
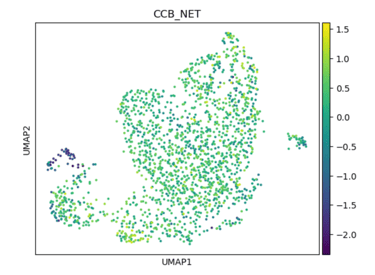
Fig 17. UMAP of endothelial cells colored by CCB_score. Subpopulations with higher scores are predicted to respond to calcium channel blockers, reflecting intact Ca²⁺-dependent eNOS signaling and antioxidant defense mechanisms.
Panel D: ACEi_NET Score
Role / Why it’s needed:
Identifies subclusters likely to respond to calcium channel blockers, highlighting Ca²⁺-dependent NO signaling and oxidative stress protection.
What it shows:
Subclusters with higher CCB scores (e.g., CALM1–3, PRKG1, SOD3) indicate functional ECs where calcium-mediated eNOS activation is intact, revealing cluster-specific drug susceptibility.
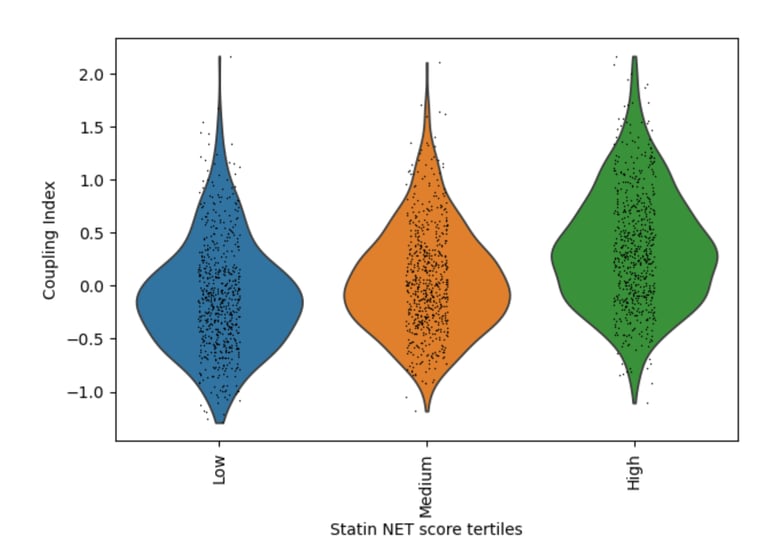
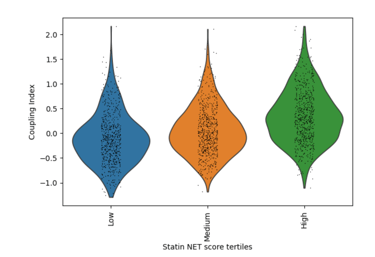
Fig 18. Violin plot of Coupling Index across Statin_NET tertiles. Cells with higher statin-associated transcriptional scores demonstrate enhanced endothelial coupling, consistent with statin-mediated promotion of nitric oxide signaling and anti-inflammatory endothelial states.
Role / Why it’s needed:
Evaluates whether statin-associated endothelial transcriptional programs correspond to improved endothelial coupling, reflecting enhanced nitric oxide bioavailability and reduced inflammatory activation.
What it shows:
Endothelial cells stratified into low, medium, and high Statin_NET tertiles exhibit progressively higher Coupling Index values, indicating that statin-like transcriptional states are associated with improved endothelial functional coupling through upregulation of NOS3/KLF2 and suppression of inflammatory adhesion molecules.
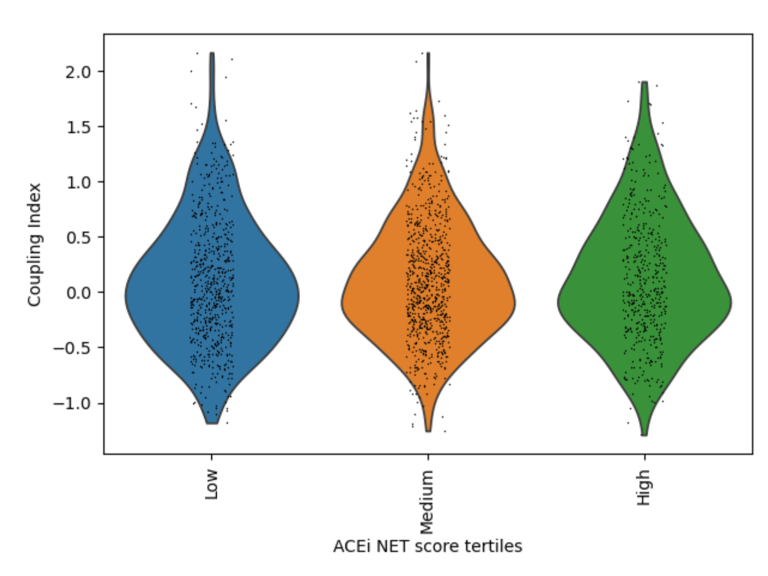
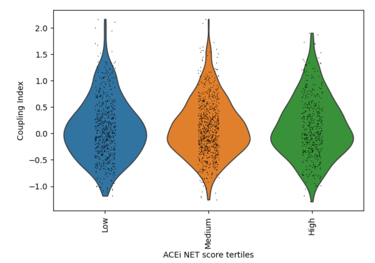
Fig 19. Violin plot of Coupling Index across ACEi_NET tertiles. Higher ACE inhibitor–associated transcriptional scores are associated with modest increases in endothelial coupling, consistent with indirect NO-supportive and antioxidant effects.
Role / Why it’s needed:
Assesses the relationship between ACE inhibitor–associated transcriptional programs and endothelial coupling, reflecting modulation of the renin–angiotensin system and oxidative stress pathways.
What it shows:
Cells with higher ACEi_NET scores display moderately increased Coupling Index values compared to low-score cells, suggesting partial enhancement of endothelial functional coupling through ACE2/HMOX1-associated cytoprotective and vasodilatory pathways.
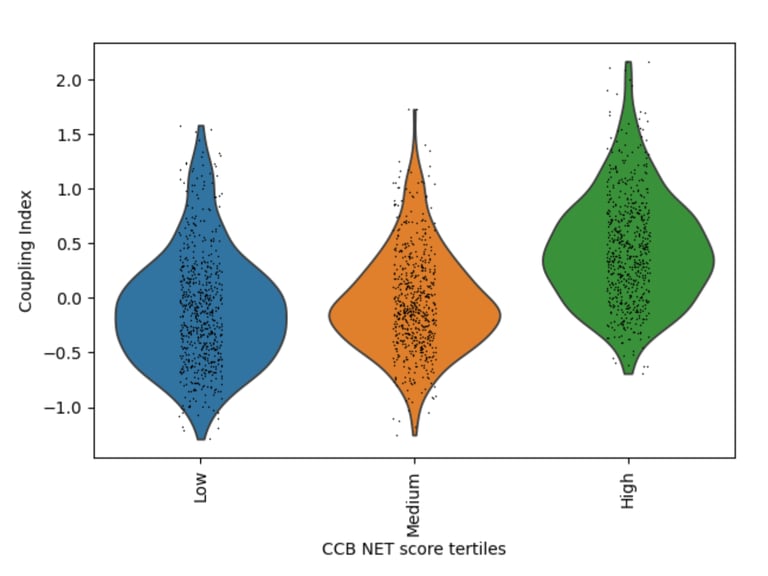
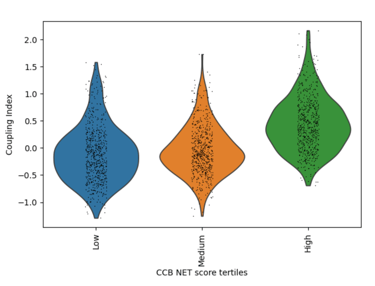
Fig 20. Violin plot of Coupling Index across CCB_NET tertiles. Endothelial cells with higher CCB-associated transcriptional scores show markedly enhanced coupling, highlighting the central role of calcium-dependent signaling and redox balance in endothelial functional integrity.
Role / Why it’s needed:
Determines whether calcium channel blocker–associated endothelial transcriptional states are linked to enhanced functional coupling, reflecting calcium-dependent nitric oxide signaling and redox adaptability.
What it shows:
A strong monotonic increase in Coupling Index is observed across CCB_NET tertiles, with high-score cells exhibiting the greatest coupling. This indicates that calcium-responsive endothelial programs are tightly aligned with functional NO signaling and oxidative stress resilience.
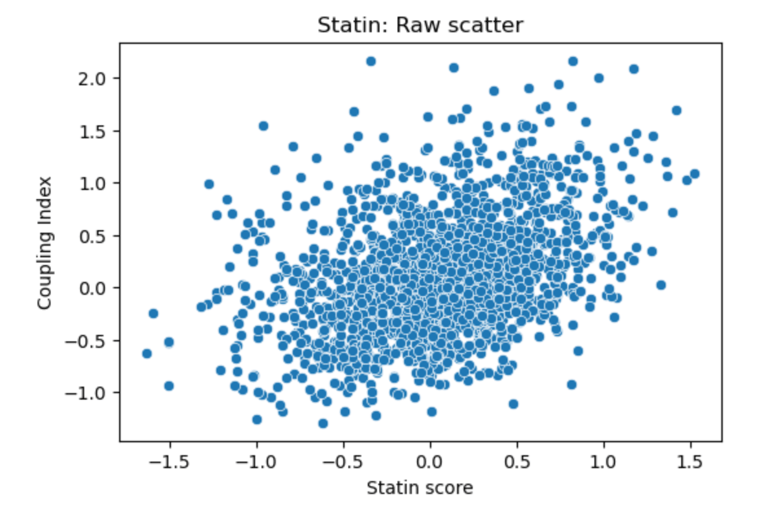
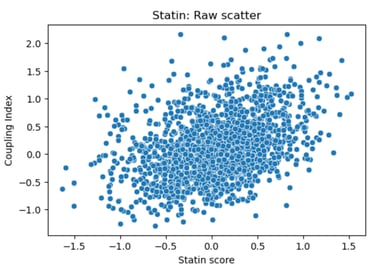
Fig 21. Scatter plot of Coupling Index versus Statin_NET score. Each point represents a single endothelial cell. This plot displays the raw distribution of cells, highlighting cluster-specific differences in predicted statin responsiveness and NO bioavailability, without fitting a regression line.
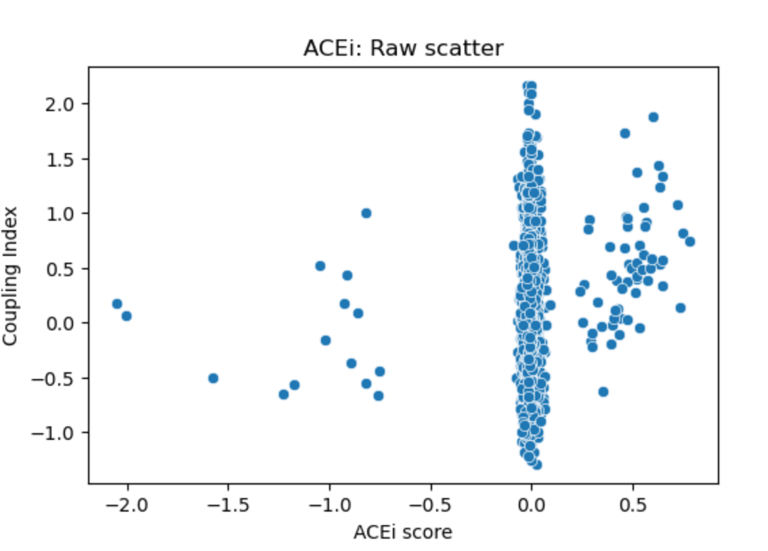
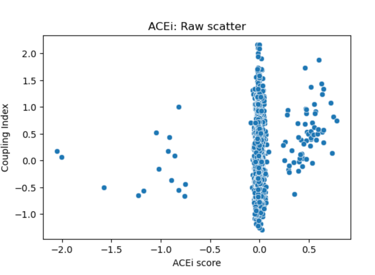
Fig 22. Scatter plot of Coupling Index versus ACEi_NET score. Each point represents a single endothelial cell. The plot illustrates the distribution of predicted ACE inhibitor responsiveness across clusters; minimal correlation is observed without regression fitting.
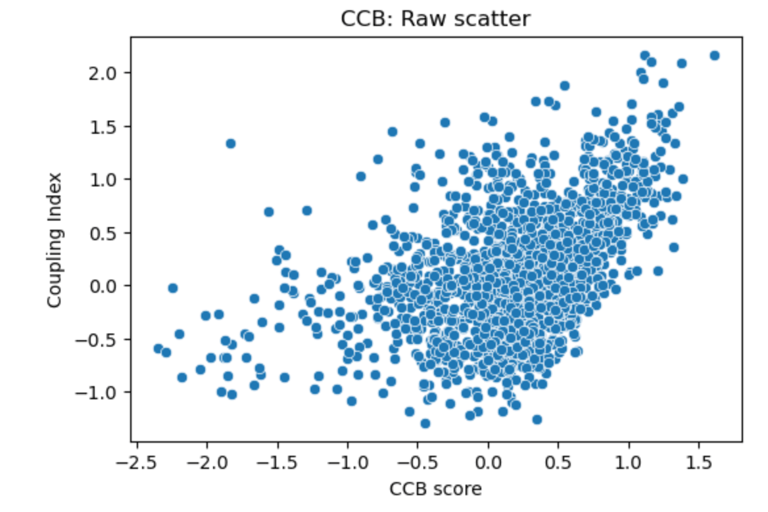

Fig 23. Scatter plot of Coupling Index versus CCB_score. Each point represents a single endothelial cell. Raw scatter highlights subcluster-specific variation in predicted calcium channel blocker responsiveness and NO coupling without regression modeling.
Figure All above scatter plots. Scatter plots of Coupling Index versus predicted drug scores in endothelial subclusters. Each point represents a single cell, with the x-axis showing predicted Statin_NET, ACEi_NET, or CCB_score, and the y-axis showing the Coupling Index. No regression line is shown; these plots display the raw distribution of cells, illustrating cluster-specific variation in predicted drug responsiveness and NO coupling across endothelial subpopulations.
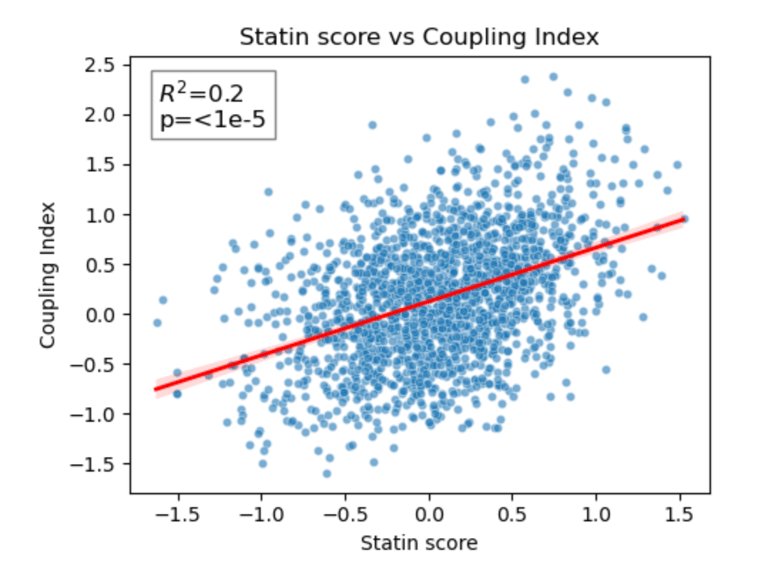
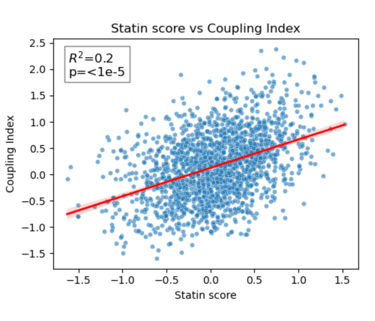
Fig 24. Coupling Index versus Statin_NET score with linear regression. Red line indicates the regression fit, R²=0.20, p < 1×10⁻⁵. This demonstrates a moderate positive correlation between predicted statin responsiveness and NO bioavailability across endothelial subclusters.
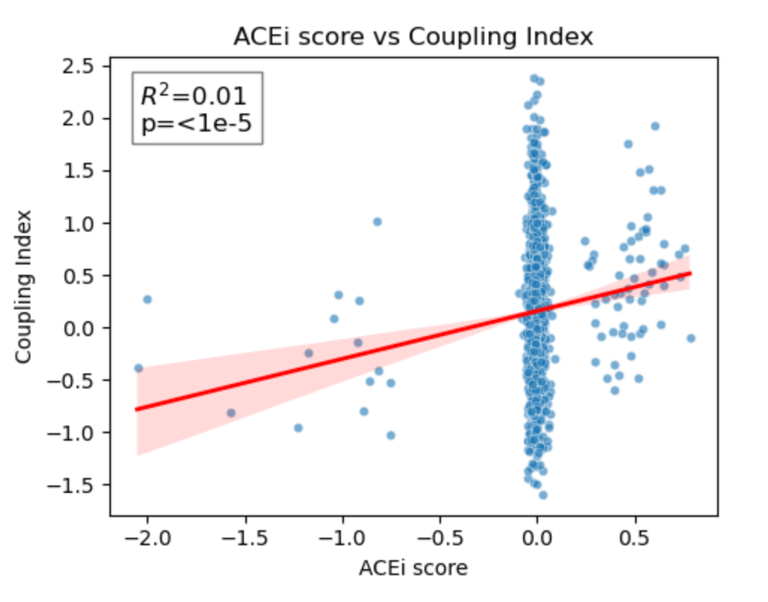
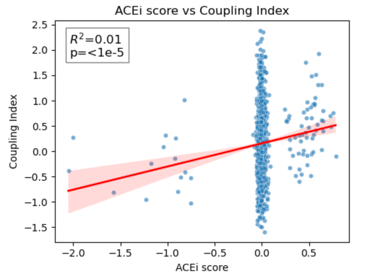
Fig 25. Coupling Index versus ACEi_NET score with linear regression. Red line indicates the regression fit, R²=0.01, p < 1×10⁻⁵. These data show minimal correlation between predicted ACE inhibitor responsiveness and NO coupling across endothelial subclusters.

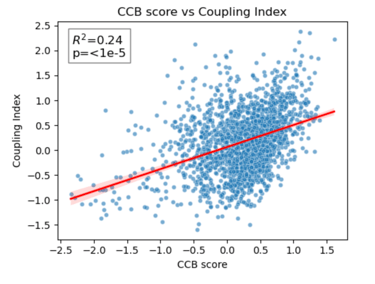
Fig 26. Coupling Index versus CCB_score with linear regression. Red line indicates the regression fit, R²=0.24, p < 1×10⁻⁵. Moderate positive correlation demonstrates cluster-specific association between predicted CCB responsiveness and NO bioavailability.
Scatter plots show Coupling Index versus Statin_NET, ACEi_NET, and CCB_score for each endothelial subcluster. Red lines represent the linear regression fit, with R² values quantifying the proportion of variance in Coupling Index explained by each drug score. Statin (R²=0.20) and CCB (R²=0.24) show moderate positive correlation with NO coupling, whereas ACEi (R²=0.01) shows minimal association. All correlations are statistically significant (p < 1×10⁻⁵), demonstrating cluster-specific functional trends in predicted drug responsiveness.
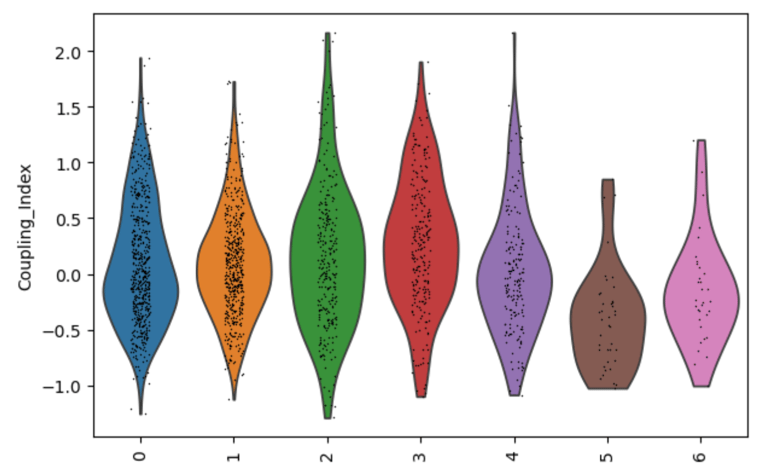
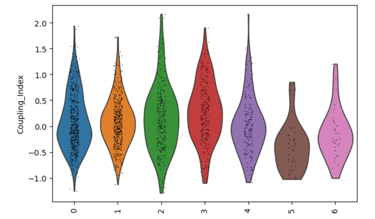
Fig 27. Violin plot of Coupling Index across endothelial cell subclusters. The Coupling Index, calculated from NO, BH4, secondary cofactor, and ROS genes, reflects baseline endothelial health and flow-responsiveness. Subcluster-specific differences highlight functional heterogeneity within the endothelium.
Coupling Index by subcluster
Why is it needed?
Establishes baseline endothelial functional heterogeneity.
Shows which EC subclusters are healthier (high Coupling Index) or more stressed (low Coupling Index).
Provides a reference map of endothelial biology before looking at drug effects.
Helps interpret cluster-specific responses to drugs later — you know which subclusters are intrinsically high or low in NO, BH4, ROS, etc.
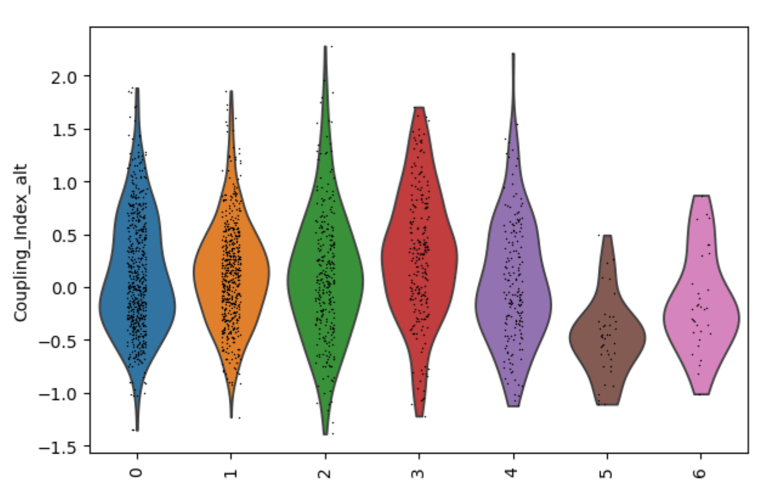

Fig 27. Violin plot of Coupling Index across endothelial cell subclusters using alternate ROS and BH4 gene sets. Comparison with the original Coupling Index demonstrates that subcluster-specific patterns and overall trends are robust to changes in module definitions, supporting the reliability of our endothelial health scoring.
Sensitivity to alternate gene sets
Why is it needed?
Tests robustness of your Coupling Index: does the pattern across subclusters change if you slightly modify the genes in the BH4 or ROS modules?
Ensures results are not dependent on the exact choice of genes, which strengthens credibility.
Confirms that any cluster-specific trends or drug correlations observed are biologically meaningful, not artifacts of module definitions. Examine figure 11 and figure 12 to see some correlations between an alternate gene set of ROS and BH4 to confirm biological significance, not just gene selection.
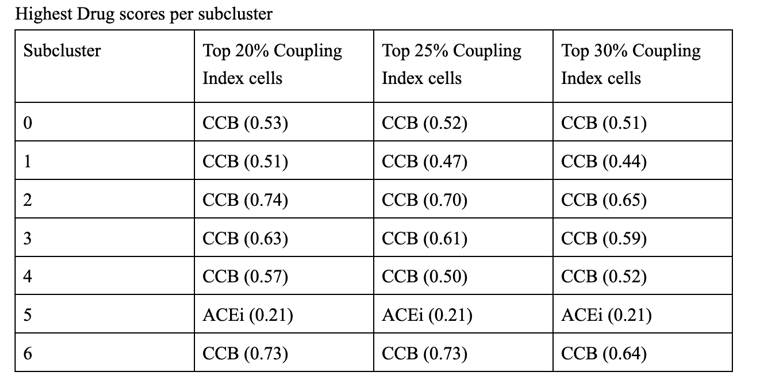
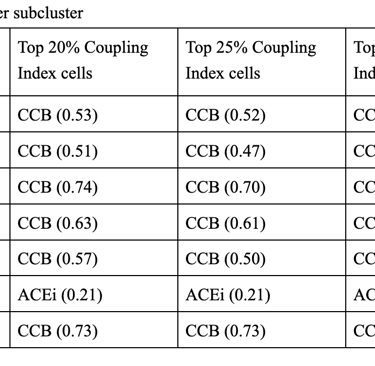
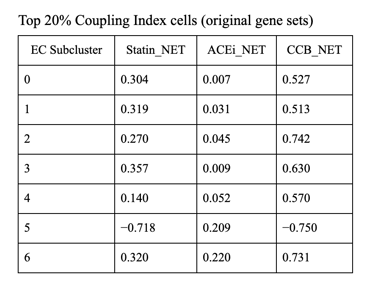
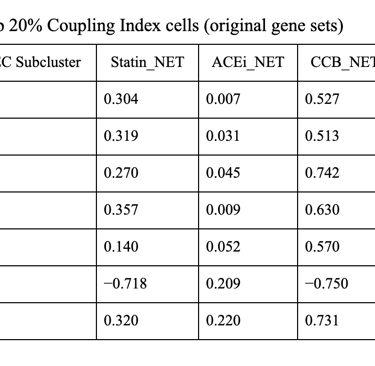
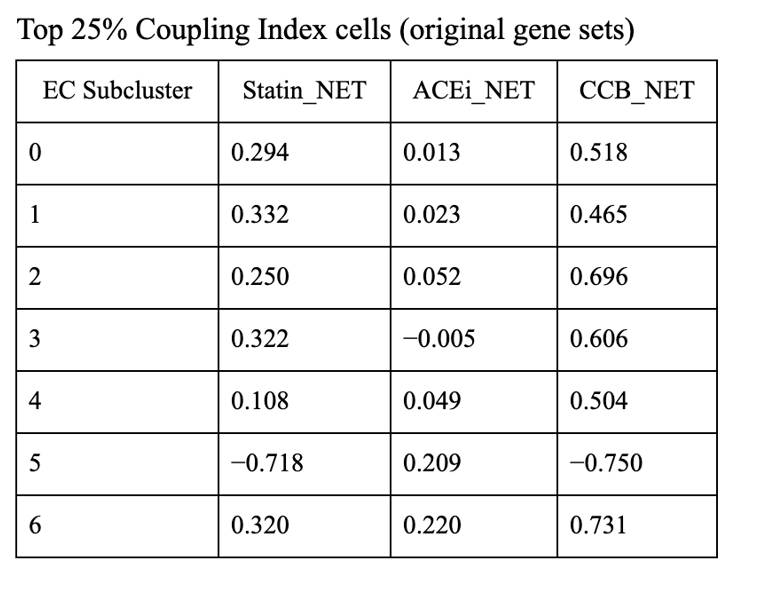
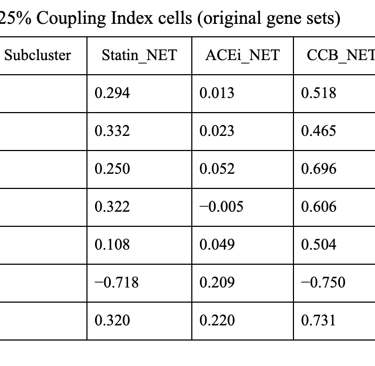
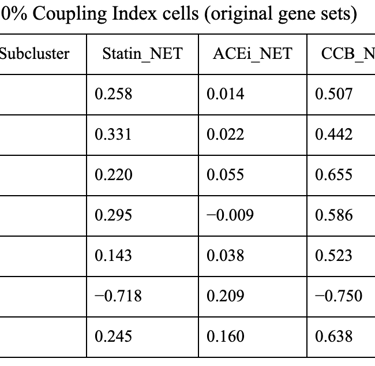
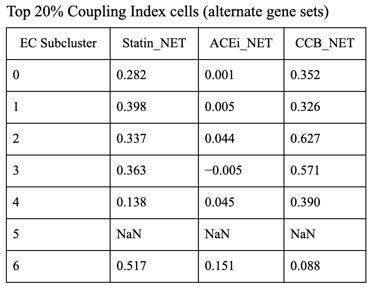
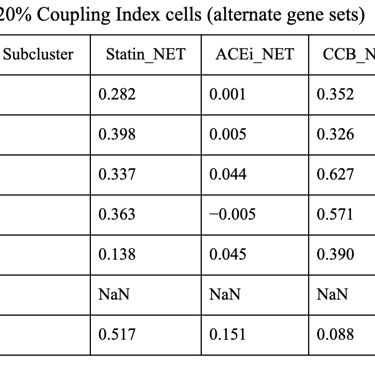
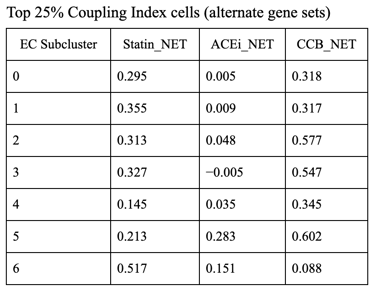
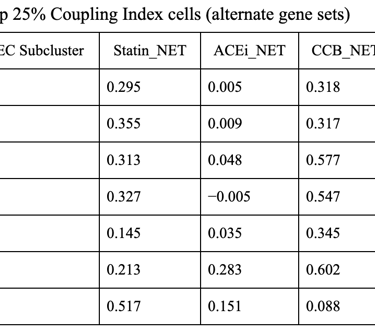
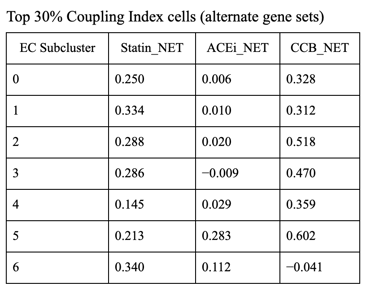
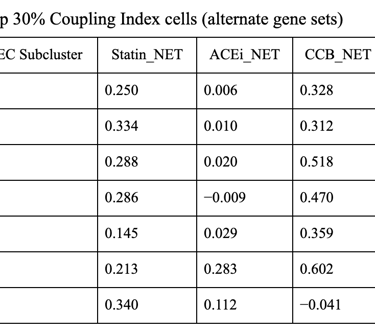
1. CCB dominance is striking and consistent
6 out of 7 subclusters show CCB_NET as the highest score across all coupling thresholds.
Calcium-dependent signaling is the most tightly aligned with high endothelial NO coupling.
2. Subcluster 5 is a clear exception
Subcluster 5 consistently favors ACEi, despite:
Negative Statin_NET
Negative CCB_NET
This suggests:
A non–calcium-dominant, possibly RAS/bradykinin-driven endothelial program
Likely a distinct endothelial state (possibly venous-like or inflammatory-resolving)
3. Robustness across thresholds
The identity of the highest drug score does not change when moving from:
Top 20% → Top 25% → Top 30% Coupling Index
Drug–coupling associations are not driven by an arbitrary cutoff, but reflect stable subcluster biology.