ECG/EKG Basics: The link between ECGs and Action Potentials
After reading our article on the cardiac action potential, learn more about how the cardiac action potential can be linked to the electrocardiogram to see the heart's electrical activity.
ECG/EKG
Avya Patel
5/13/20254 min read
ECG/EKG Basics: The link between ECGs and Action Potentials
What is an ECG/EKG?
An ECG/EKG, otherwise known as an electrocardiogram is a quick test to check the heartbeat. It records the electrical signals in the heart that are generated by cardiac action potentials, which then are converted to waveforms depicted by a P wave, QRS complex, T wave, and sometimes a U wave. The interpretation of the ECG can allow physicians to come up with a diagnosis for various arrythmias, a heart attack, and other cardiac diseases.
How ECG records electrical signals
An ECG (electrocardiogram) records the heart's electrical signals using electrodes placed on the skin, typically on the chest, arms, and legs. These electrodes detect small voltage changes within the heart’s conduction system due to depolarization and repolarization with the signal originating from the SA node, making its way to the AV node, later leading to cardiac myocytes depolarization and repolarization as explained in thecardiosphere’s article, Understanding the Heart’s electrical conductive system through Action Potentials.
What each wave represents (P, QRS, T)
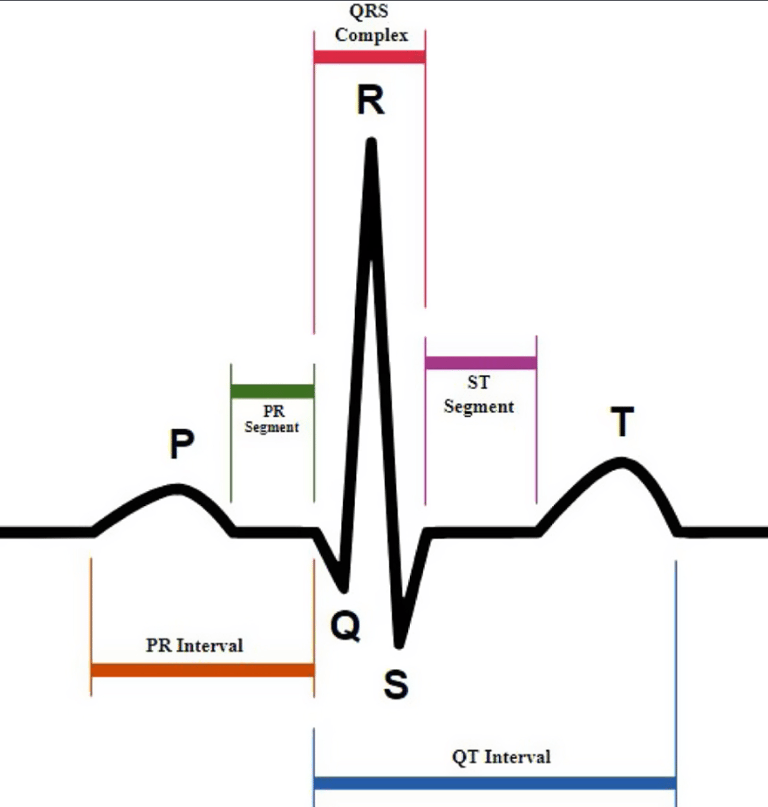
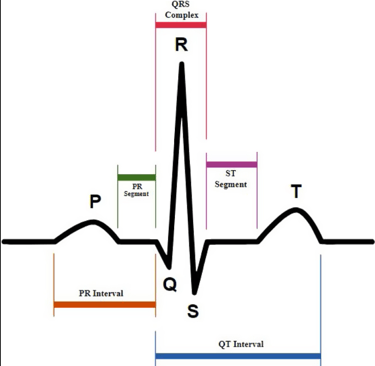
The ECG machine captures these electrical impulses and displays them as waveforms, including the P wave, QRS complex, and the T wave.
P wave: represents atrial depolarization, which is the electrical activity that triggers the contraction of the atria.
QRS complex: follows the P wave after the PR interval, represents ventricular depolarization and atrial repolarization, and this depolarization of the ventricles causes them to contract.
T wave: represents ventricular repolarization, which is the recovery phase as the ventricles reset electrically to prepare for the next beat that will be originated by the SA node, starting with the P wave.
Linking Action Potentials to ECG Waves
P wave: Atrial depolarization (SA node firing)
The P wave reflects the depolarization of the atria, initiated by the sinoatrial (SA) node, the heart’s natural pacemaker which generates impulses around 60-100 times/minute. When the SA node fires, it sends an electrical impulse through the walls of the right and left atria, causing atrial myocytes to depolarize (depolarization always results in contraction). This is the first step in the cardiac cycle and ensures blood is pushed from the atria into the ventricles through contraction. The action potential in atrial cells shows a rapid influx of sodium (Na⁺) during depolarization, raising the membrane potential to +30mV which corresponds to the P wave on the ECG. See phases of depolarization and repolarization to examine the P wave and the cardiac action potential side-by-side. If the P wave is abnormal, it can indicate issues such as atrial enlargement or arrhythmias like atrial fibrillation.
PR interval: AV node delay
The PR interval spans from the start of the P wave to the beginning of the QRS complex and represents the time it takes for the electrical impulse to travel from the SA node through the atria, the AV node, and into the His-Purkinje system. The key event here is the delay at the atrioventricular (AV) node, which slows the conduction to allow the ventricles time to fully fill with blood from the atria before they contract. In terms of action potentials, the AV nodal cells conduct more slowly due to fewer fast sodium channels and a greater reliance on slow calcium channels as well as to ensure ventricular filling. A prolonged PR interval may indicate first-degree AV block which can progress further, while a shortened one can be seen in conditions like Wolff-Parkinson-White syndrome.
QRS complex: Ventricular depolarization
The QRS complex reflects rapid depolarization of the ventricles, which initiates ventricular contraction (systole). The electrical impulse travels from the AV node through the bundle of His, right and left bundle branches, and Purkinje fibers, leading to synchronous activation of the ventricular myocardium. The rapid influx of Na⁺ into ventricular myocytes causes a sharp spike in voltage, with a peak due to Ca2+ influx, resulting in the steep action potential upstroke seen in these cells. See phases of depolarization and repolarization to examine the QRS complex and the cardiac action potential side-by-side. The QRS complex is normally narrow, indicating efficient and fast conduction. The major reason for such a narrow QRS complex is to ensure a swift contraction of the right and left ventricles to push blood into the aorta and pulmonary vein. QRS abnormalities can be detected on a variety of leads, and can suggest bundle-branch-blocks, ventricular arrhythmias, etc…
T wave: Ventricular repolarization
The T wave represents ventricular repolarization, where the ventricular cells restore their resting membrane potential, making them ready for the next cycle. This corresponds to the efflux of potassium (K⁺) out of the myocytes, which is the third phase of the ventricular action potential. See phases of depolarization and repolarization to examine the T wave and the cardiac action potential side-by-side. Unlike depolarization, repolarization occurs in the opposite direction of initial activation but still appears upright on the ECG due to the vector orientation. Abnormal T waves can signal ischemia, electrolyte imbalances (e.g., hyperkalemia or hypokalemia), or myocardial injury.
*U wave: Unknown relation
The U wave is a small, often not visible, wave that follows the T wave. Its exact origin is uncertain, but several theories exist; it may represent repolarization of the Purkinje fibers or late repolarization of mid-myocardial (M cells).U waves are more prominent in bradycardia and during hypokalemia. A prominent U wave may be seen in conditions like hypokalemia, hypocalcemia, or thyrotoxicosis, while inverted U waves may suggest ischemia or left ventricular overload.
ST segment: High clinical relevance in detecting myocardial infarctions.
The ST segment begins at the end of the QRS complex (the J point: after the S wave) and ends at the start of the T wave. It represents the plateau phase (Phase 2) of the ventricular action potential.
The ST segment reflects the period when the ventricles are uniformly depolarized in Phase 2 and there is no net movement of charge, so it should appear as a flat, isoelectric line on the ECG.
QT interval: How long ventricular electrical activity occurs.
The QT interval begins at the start of the QRS complex and ends at the end of the T wave. It encompasses the full time required for the ventricles to depolarize and then repolarize.
The QT interval has clinical significance to detect abnormalities in ventricular electrical activity, leading to ventricular arrhythmias.