ECG/EKG Basics: Interpreting the parts of an ECG, leads, and common waveforms
Blog post description.
ECG/EKG
5/28/20254 min read
ECG/EKG Basics: Interpreting the parts of an ECG, leads, and common waveforms
Reading and Interpreting an ECG
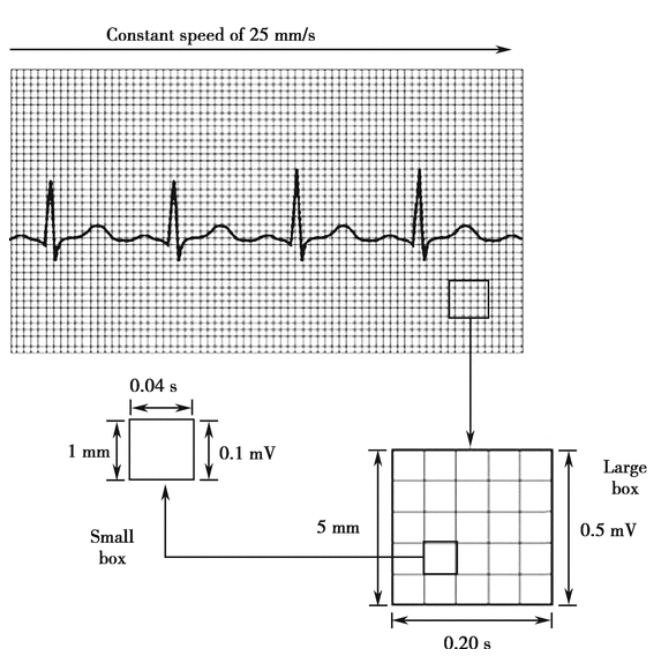
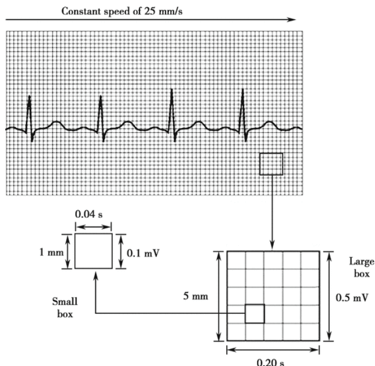
Each large box represents 0.2 seconds on the horizontal axis and each small box represents 0.04 seconds on the horizontal axis.
On the vertical axis, each large box is roughly 5 mm in height, and represents 0.5mV of voltage. Therefore, each small box is 1 mm in height, and represents 0.1mV of voltage.
Rate, rhythm, axis, intervals, and morphology
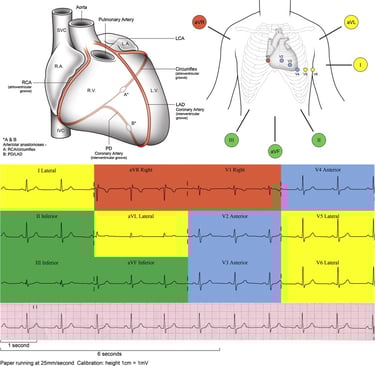
Above is a traditional ECG strip, with the line running through the middle on each view established as the “baseline for electrical activity” or the isoelectric line.
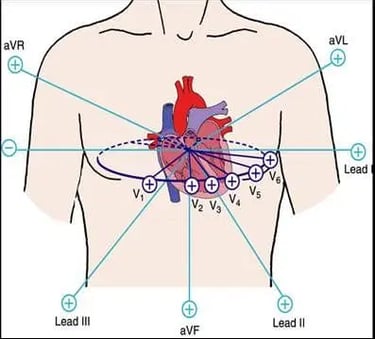
Each lead, or view looks at unique parts of the heart’s electrical activity, which is why some rhythms differ from others.
The rhythms seen above are created by electrical vectors in which the heart’s electrical activity is detected through vectors which point to the lead placements.
Regular vs. Irregular rhythms:
In ECG analysis, rhythms can be either regular or irregular. A regular rhythm means that the time intervals between heartbeats are consistent, while an irregular rhythm indicates variability in these intervals.
The rhythm can be described in 3 ways : Regular (metronome like with every beat equally spaced), Regularly Irregular (every beat not equally spaced but there is a distinct pattern), for example, every 2-3 beats, and Irregularly Irregular (sporadic pattern of beats with no clear spacing)
Rhythm:
A rhythm is regular if there are regular spacings between the R-R intervals.
A sinus rhythm (originating from the sinus node) always has a P wave preceding the QRS complex with the slight AV nodal delay, and a constant PR interval. Several irregular rhythms include Atrial fibrillation (irregularly irregular), second-degree AV block (missing QRS), etc.
Rate:
Normal rate: 60–100 beats per minute (bpm).
Quick method (Regular rhythm): Regular spacing between all waveforms
Use the 300 rule: Divide 300 by the number of large squares between two consecutive R waves.
Example: If there are 5 large squares between R waves → 300 / 5 = 60 bpm
Alternative (Irregular rhythm): Pattern between unequal spacing of beats, or pattern less beats.
Count the number of R waves in a 10-second strip, then multiply by 6.
Axis:
Normal QRS axis: –30° to +90°
Quick method:
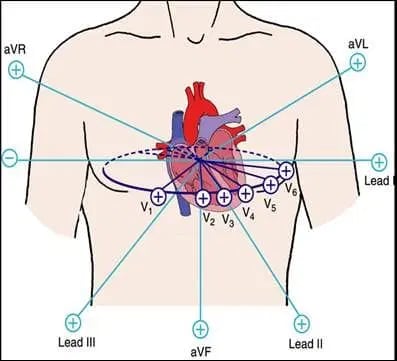
Look at leads I and aVF:
Both positive → Normal axis
Lead I positive, aVF negative → Left axis deviation
Lead I negative, aVF positive → Right axis deviation
Both negative → Extreme axis deviation
Intervals:
Measure:
PR interval: 120–200 ms (3–5 small squares)
QRS duration: <120 ms (<3 small squares)
QT interval: Corrected QT (QTc) varies with heart rate, usually <440 ms (men) and <460 ms (women)
Look for:
Prolonged PR → First-degree AV block
Short PR → Pre-excitation syndromes like WPW
Prolonged QRS → Bundle branch block or ventricular rhythm
Common morphology
Analyze the patterns on each lead view and note any abnormalities.
P wave
Normal: upright in leads I, II, aVL; inverted in aVR
Look for:
Peaked → Right atrial enlargement
Notched/broad → Left atrial enlargement
QRS complex
Look at width, shape, and voltage
Tall QRS → Hypertrophy
Wide QRS → Bundle branch blocks (RBBB, LBBB)
Pathologic Q waves → Previous Myocardial Infarction
ST segment
Should be flat (isoelectric)
Elevation → Myocardial infarction (STEMI)
Depression → Ischemia, digoxin effect
T wave
Normal: Upright in most leads
Inverted T waves → Ischemia, strain, or CNS causes
Tall T waves → Hyperkalemia or early MI
U wave
Seen in hypokalemia or bradycardia; small positive wave after T wave
Basic Regular ECG Patterns and What They Mean
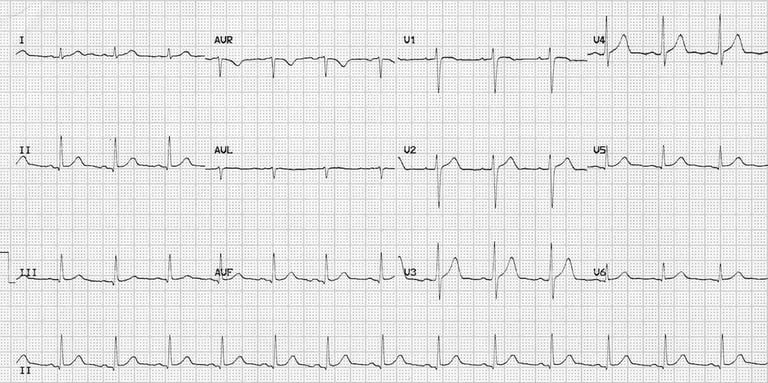
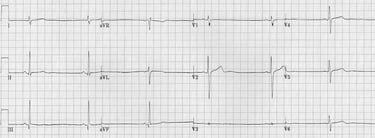
Normal sinus rhythm
Normal sinus rhythm (NSR) refers to a regular and healthy heart rhythm where the electrical signals originate from the sinoatrial (SA) node, and are properly transmitted through the cardiac myocytes.
A normal sinus rhythm reflects a heart rate of 60-100 bpm with no abnormalities in any ECG leads; a peaked QRS complex with a preceding P wave, and ends with a T wave.
On an ECG, a normal sinus rhythm is characterized by a regular rhythm, a P wave for every QRS complex, and a consistent P-R interval.
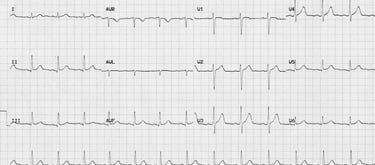
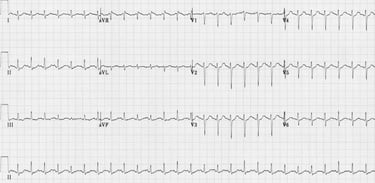
Sinus Bradycardia
Sinus bradycardia refers to a regular and healthy heart rhythm (although slower) where the electrical signals originate from the sinoatrial (SA) node, and are properly transmitted through the cardiac myocytes but at a slower rate than NSR.
Sinus Bradycardia is not always characterized as a pathology or abnormality, instead, it is often a normal finding in athletes, well-conditioned individuals, and those taking certain medications. It's also common in older adults.
A bradycardia sinus rhythm reflects a heart rate slower than 60 bpm with no abnormalities in any ECG leads; a peaked QRS complex with a preceding P wave, and ends with a T wave. This rhythm, although not a normal sinus rhythm, is regular with a constant, predictable rhythm.
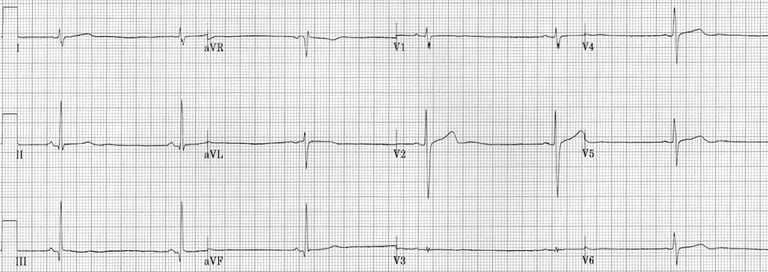
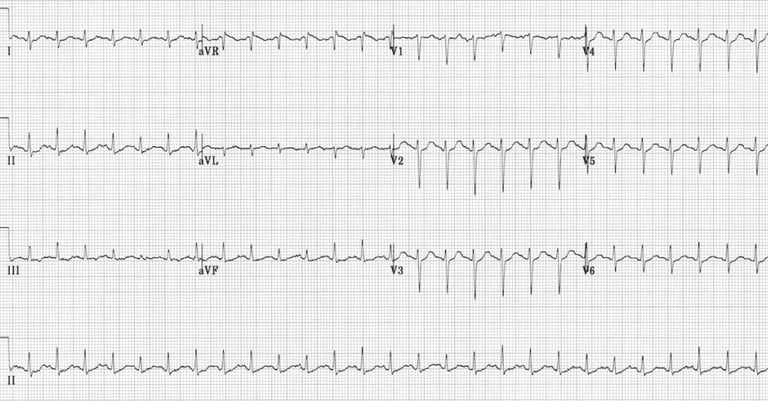
Sinus tachycardia
Sinus tachycardia is normally always characterized as a pathology or abnormality, it is common in high stressed patients while often a normal response to things like exercise or stress, sinus tachycardia can also be triggered by underlying medical conditions or factors like anxiety, fever, or dehydration.
A tachycardia sinus rhythm reflects a heart rate above 100 bpm with no abnormalities in any ECG leads; a peaked QRS complex with a preceding P wave, and ends with a T wave. This rhythm, although not a normal sinus rhythm, is regular with a constant, predictable rhythm.
Sinus tachycardia can cause supraventricular tachycardia, and comes with symptoms such as dizziness, fatigue, shortness of breath (SOB), chest pain, etc…